Lab 04-03: Load and parallelism¶
Objective¶
Use a load script to measure what happens when 4 clients query a server together with
-np 1, -np 2 and -np 4: latency of the single request, aggregate throughput (tokens generated per second
summed over all clients), slots busy at the same time. And see with your own eyes the price of
parallelism: the context -c is split among the slots.
Prerequisites¶
- Lab 04-01 (you can read
n_ctx_slotin the log andtimingsin the responses). - Python 3 (standard library only:
carico.pyhas no dependencies). - A "quiet" machine: close the browser and other heavy processes, the numbers depend on the free cores.
Materials¶
| What | Where | Size |
|---|---|---|
ggml-org/Qwen3.5-0.8B-GGUF (file Qwen3.5-0.8B-Q8_0.gguf, Apache 2.0) |
Hugging Face, via -hf |
785 MiB |
carico.py: sends N requests in parallel with ThreadPoolExecutor, samples /slots every 0.5 s, prints latencies and throughput |
lab folder | 4 KB |
The script uses 8 different prompts (one per request) because with the same prompt the prompt cache would skew the
comparison, and it turns off thinking with chat_template_kwargs so the 32 generated tokens are all answer.
Steps¶
The measurements shown come from a 6 vCPU machine without GPU (-t 3): the absolute values on your
machine will differ, the ratios will not.
-
Server with a single slot:
llama serve -hf ggml-org/Qwen3.5-0.8B-GGUF --host 127.0.0.1 --port 8080 -c 2048 -np 1 -t 3 -a qwen-0.8bLog:
n_slots = 1, n_ctx_slot = 2048. From another terminal:cd corso/laboratori/lab-04-03-parallelismo python3 carico.py --url http://127.0.0.1:8080 --richieste 4 --parallele 4 --token 32server: 1 slot, n_ctx per slot = 2048 req 0: 8.54 s 32 token (8.8 t/s nel proprio slot) req 1: 3.58 s 32 token (11.4 t/s nel proprio slot) req 2: 20.30 s 32 token (5.1 t/s nel proprio slot) req 3: 13.46 s 32 token (7.8 t/s nel proprio slot) richieste=4 parallele=4 slot=1 picco slot occupati insieme=1 tempo totale 20.31 s | latenza media 11.47 s, max 20.30 s throughput aggregato 6.30 token/s (128 token generati)The 4 requests arrive together but there is only one slot: they are served one at a time (
picco slot occupati = 1). Each request, when its turn comes, generates at 5-11 t/s, but the last one waited 17 s in the queue. The total time is the sum of the four. (llamacpp:requests_deferredin/metricscounts exactly these waits.) -
Two slots. Stop the server with Ctrl+C and restart it with
-np 2(everything else the same), then repeat the test:server: 2 slot, n_ctx per slot = 1024 req 0: 14.08 s 32 token (3.0 t/s nel proprio slot) req 1: 12.89 s 31 token (3.2 t/s nel proprio slot) req 2: 22.28 s 32 token (3.8 t/s nel proprio slot) req 3: 22.70 s 32 token (4.1 t/s nel proprio slot) richieste=4 parallele=4 slot=2 picco slot occupati insieme=2 tempo totale 22.76 s | latenza media 17.99 s, max 22.70 s throughput aggregato 5.58 token/s (127 token generati)Two requests advance together (
picco = 2), the other two wait. Note that the per-slot speed dropped (3-4 t/s against 5-11): on CPU the cores are already saturated by one sequence, so advancing two sequences at eachllama_decodecosts almost twice as much per step. Here the total dropped: with the cores already saturated two slots yield no more than one. Repeat a throughput measurement on CPU two or three times and average it before drawing conclusions. -
Four slots. Restart with
-np 4:server: 4 slot, n_ctx per slot = 512 req 0: 10.12 s 32 token (4.0 t/s nel proprio slot) req 1: 10.28 s 32 token (4.3 t/s nel proprio slot) req 2: 10.28 s 32 token (4.3 t/s nel proprio slot) req 3: 10.27 s 32 token (4.3 t/s nel proprio slot) richieste=4 parallele=4 slot=4 picco slot occupati insieme=4 tempo totale 10.30 s | latenza media 10.24 s, max 10.28 s throughput aggregato 12.42 token/s (128 token generati)Now the four requests start and finish together (nearly identical latencies, no queue): continuous batching advances all of them at every step. Each slot runs at 4 t/s, but there are 4 slots: the aggregate throughput doubled compared with
-np 1(12.4 against 6.3 t/s) and the maximum latency halved. The price is in the first line:n_ctx per slot = 512. With 2048 tokens of total context and 4 slots, each conversation has 512 tokens: a chat of a few turns with a long system prompt no longer fits. -
Hit the limit. With the server at
-np 4send a long prompt:python3 -c "print('Riassumi: ' + 'La banda passante della memoria limita la generazione. ' * 120)" > lungo.txt curl -s http://127.0.0.1:8080/v1/chat/completions -H "Content-Type: application/json" \ -d "{\"messages\":[{\"role\":\"user\",\"content\":\"$(cat lungo.txt)\"}],\"max_tokens\":20}"The prompt (1206 tokens, count them with
/tokenize) exceeds the slot's 512. Response:{"error":{"code":400,"message":"request (1217 tokens) exceeds the available context size (512 tokens), try increasing it", "type":"exceed_context_size_error","n_prompt_tokens":1217,"n_ctx":512}}(1217 = 1206 of text + 11 of chat template.) With
-np 1the same request goes through. -
--kv-unified: restart with-np 4 --kv-unifiedand look at the log:Four slots, but each one "sees" all 2048 tokens: the buffer is single and the active slots share it dynamically. Send the long prompt from step 4 again: now it goes through (
finish_reason: length, 20 tokens of summary). Repeatcarico.pytoo:throughput 15.3 t/s, latenza max 8.34 s, in line with-np 4without--kv-unified(12.4 t/s: the single buffer does not change compute speed, it only changes how the context is shared). The cost of the single buffer is that four long requests together can exhaust it: a request waits in the queue until there is room. -
Stop the server with Ctrl+C.
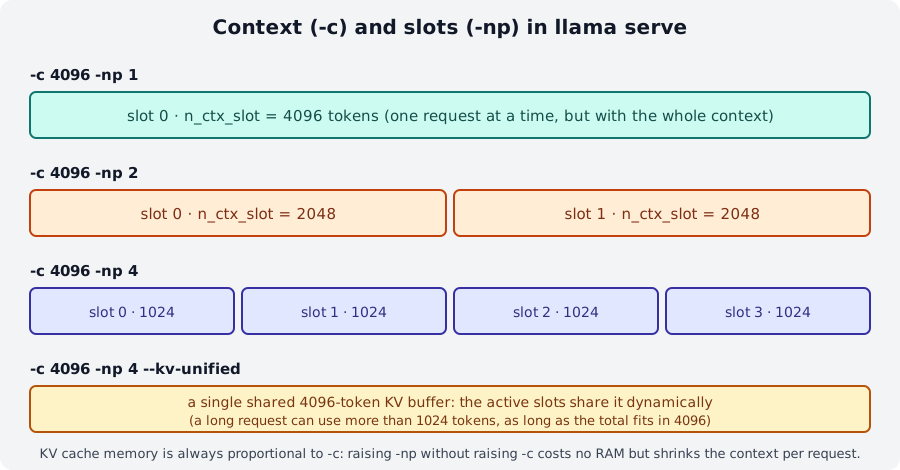
-c 2048: 1 slot of 2048, 2 of 1024 or 4 of 512. Aggregate throughput rises with the slots, context per request falls.Check the result¶
- You have three tables (
-np 1/2/4) withn_ctx per slot2048 / 1024 / 512. - With
-np 1thepicco slot occupatiis 1 and the maximum latency is about the sum of the four; with-np 4the four latencies are almost equal. - Aggregate throughput with
-np 4is higher than with-np 1(in the measurements above: ×2). - You saw the long prompt fail with 4 slots and go through with
--kv-unified.
Questions and variants¶
- Why is the per-slot speed lower with
-np 4than with-np 1, yet the total is higher? (tip: what doesllama_decodedo at each step with 4 active sequences? reread § 6 of module 04). - Try
--richieste 8 --parallele 8with-np 4: how many stay in the queue? What doesllamacpp:requests_deferredsay if you start with--metrics? - Try
--token 128: does the batching advantage grow or shrink with longer answers? - On GPU the per-slot speed drops much less going from 1 to 4 sequences (generation is limited by memory
bandwidth, not compute: module 05). If you have one, redo the three measurements with
-ngl all. - How much total context do you need for 4 conversations of 4096 tokens each? How much extra RAM does the KV cache cost (use the estimator from lab 00-01)?
-np -1(auto, the default) picks the number of slots by itself and enables--kv-unified: start without-npand read what it decided.
Deliverable¶
A file lab-04-03.md with: the three outputs of carico.py, a summary table
(np | n_ctx_slot | average latency | max latency | throughput), the error message from step 4 and the answer
to the first question in five lines.